SM D: Correlation Matrices of Case Study Data

Code
library(tidyverse)
library(ManyEcoEvo)
library(GGally)
set.seed(1234)

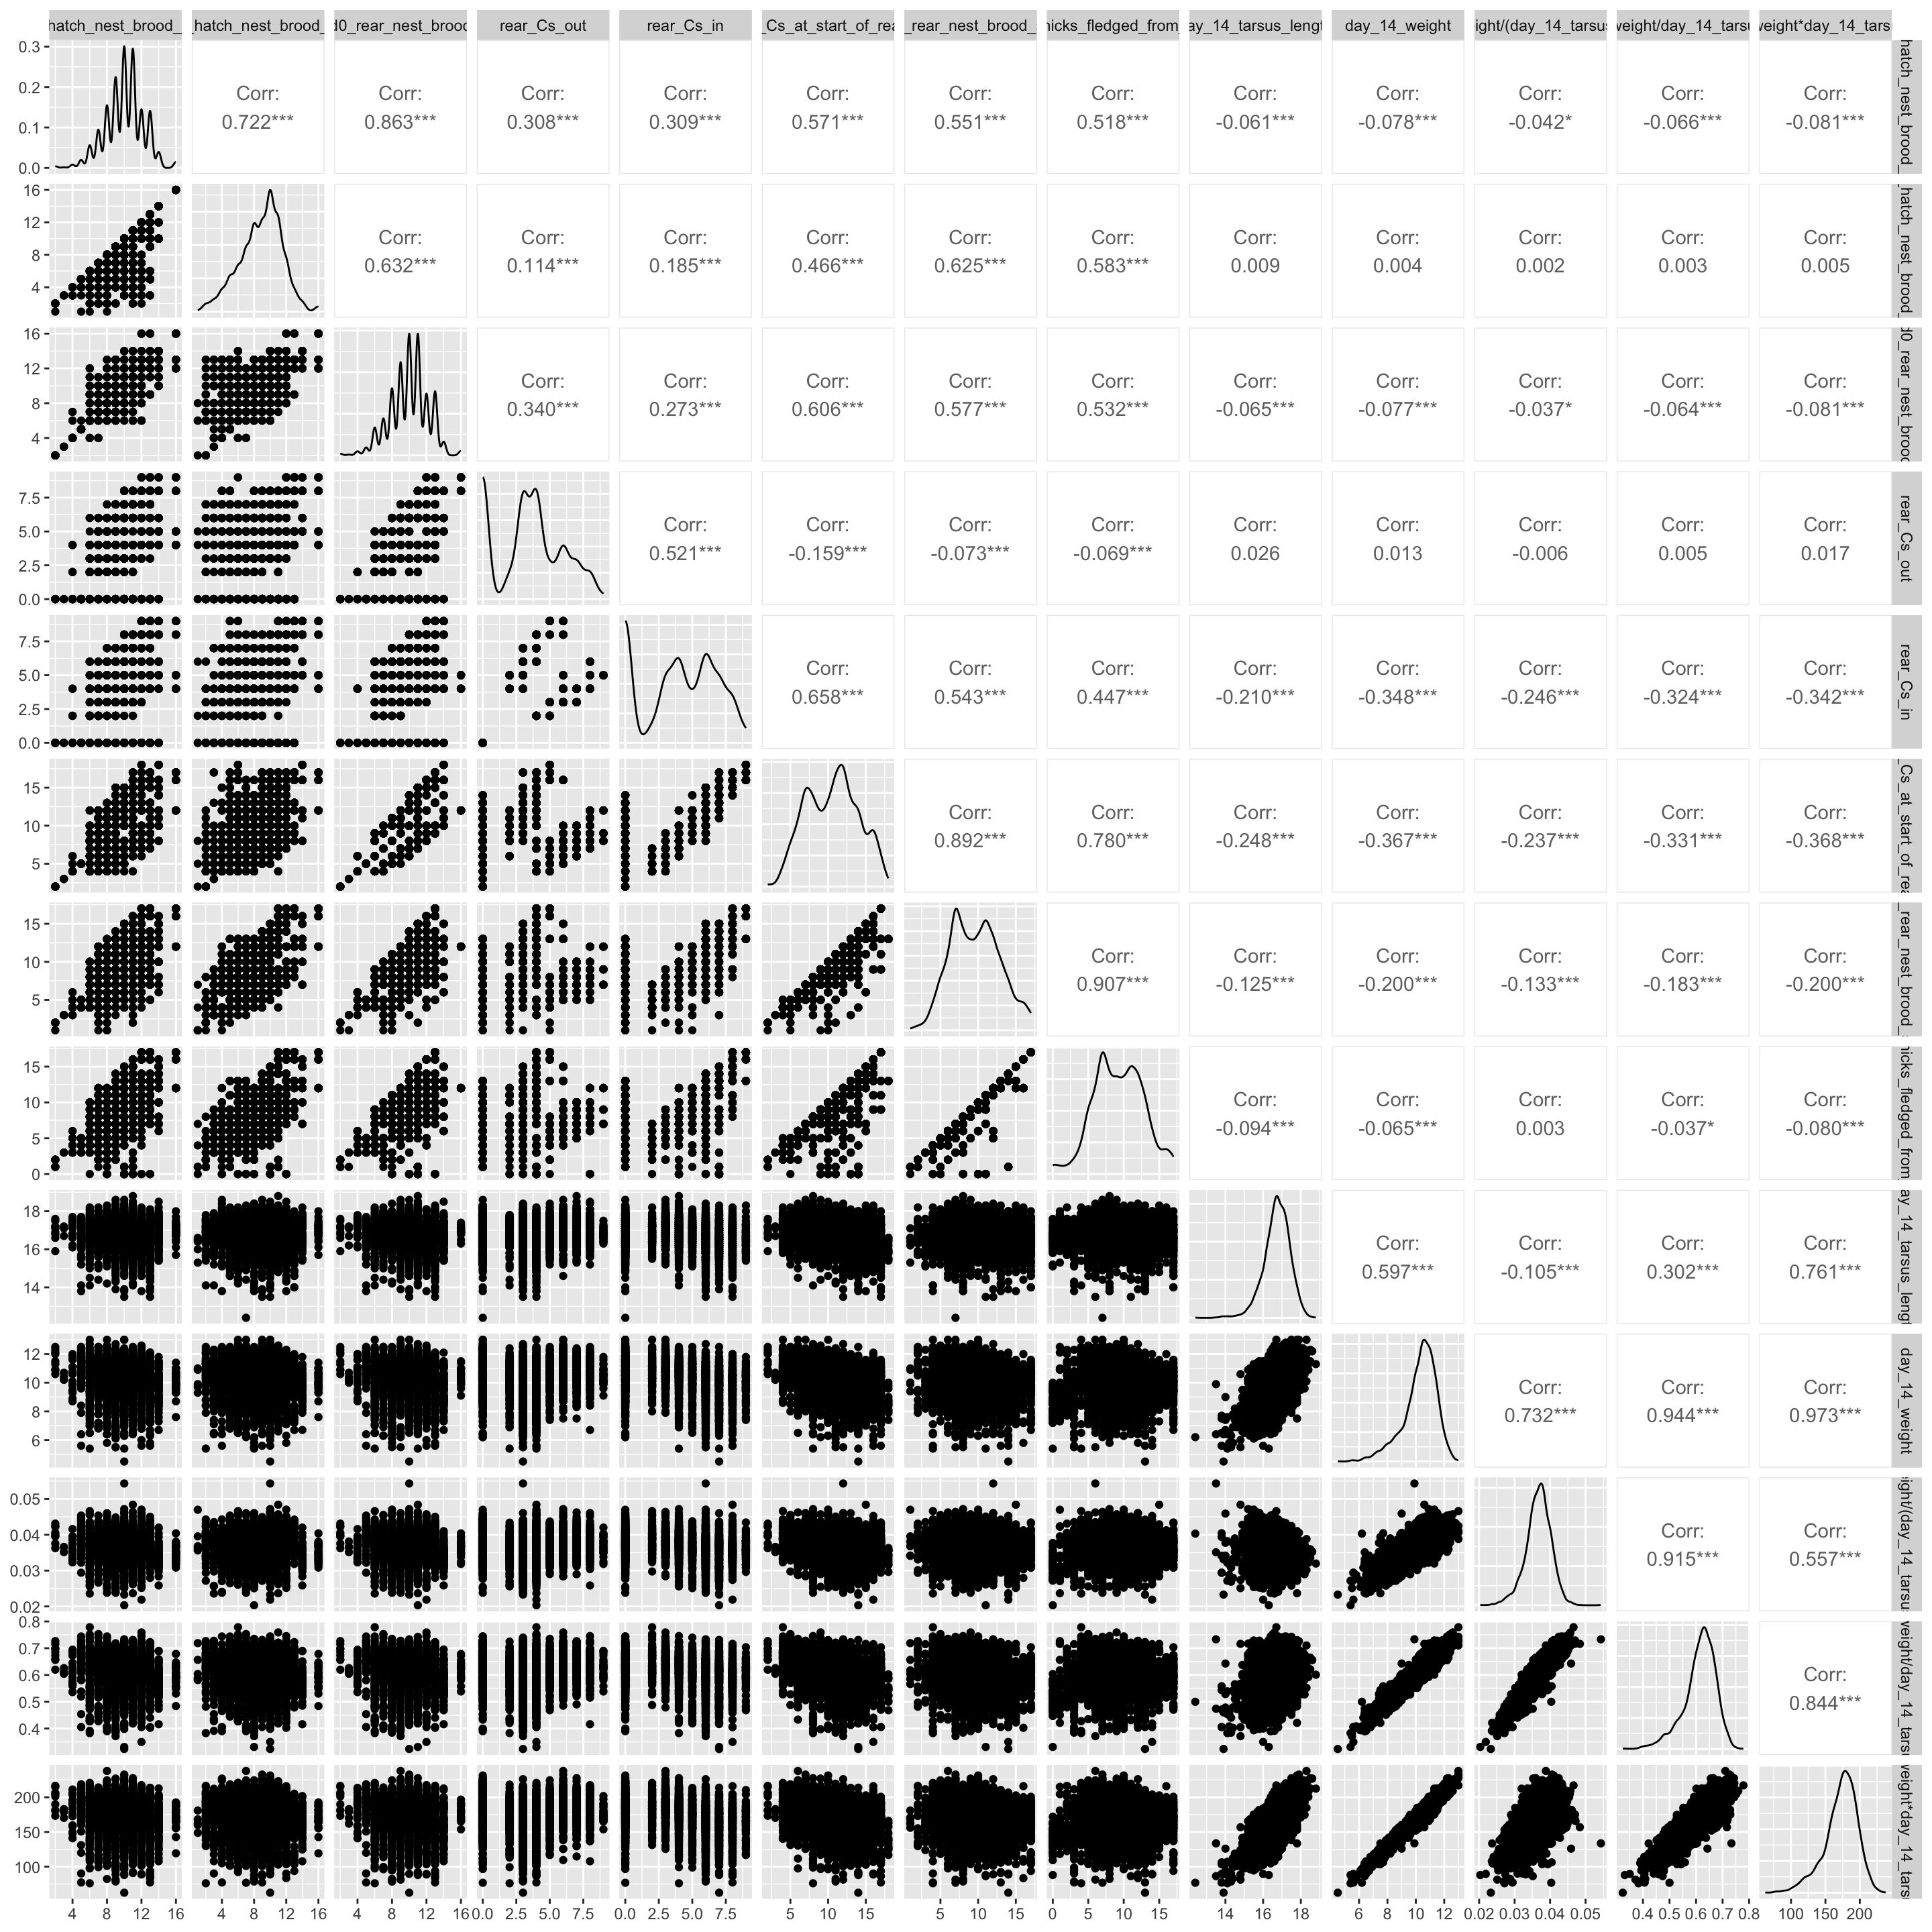
Pairwise-correlation plots for the Eucalyptus and blue tit case-study data provided to analysts are shown in Figure D.1 and Figure D.2, respectively. Plots were created with R package GGally (Schloerke et al. 2022).

Code
ManyEcoEvo::euc_data %>%
  select(where(is_double),
         -Date, 
         -`Quadrat no`,
         -Easting, 
         -Northing,
         -`small*0.25+medium*1.25+large*2.5`,
         -`average.proportion.of.plots.containing.at.least.one.euc.seedling.of.any.size`) %>%
  GGally::ggpairs()
Figure D.1: Pairwise correllation plot for all Eucalyptus dataset variables except for Date, Quadrat no, Easting, Northing.
Code
ManyEcoEvo::blue_tit_data %>%
  naniar::replace_with_na_all(condition = ~ .x == ".") %>% 
  mutate(across(c(contains("_ring"), 
                  rear_nest_trt, 
                  hatch_year, 
                  hatch_nest_breed_ID,
                  hatch_Area,
                  hatch_Box,
                  day14_measurer,
                  contains("hatch_Box"),
                  starts_with("rear_"),
                  starts_with("hatch_nest"),
                  home_or_away,
                  -rear_d0_rear_nest_brood_size,
                  contains("manipulation"),
                  chick_sex_molec,
                  Date_of_day14,
                  `Extra-pair_paternity`,
                  -rear_Cs_in,
                  -rear_Cs_out,
                  chick_survival_to_first_breed_season,
                  -rear_Cs_at_start_of_rearing), 
                as.factor),
         across(where(is.character), as.numeric),
         across(c(rear_Cs_out,
                  rear_Cs_in,
                  rear_Cs_at_start_of_rearing),
                as.integer)) %>% 
  select(where(is.numeric), -`day 14 weight`) %>% 
  GGally::ggpairs() 
Figure D.2: Pairwise correlation plot of all numeric variables in blue tit case study dataset