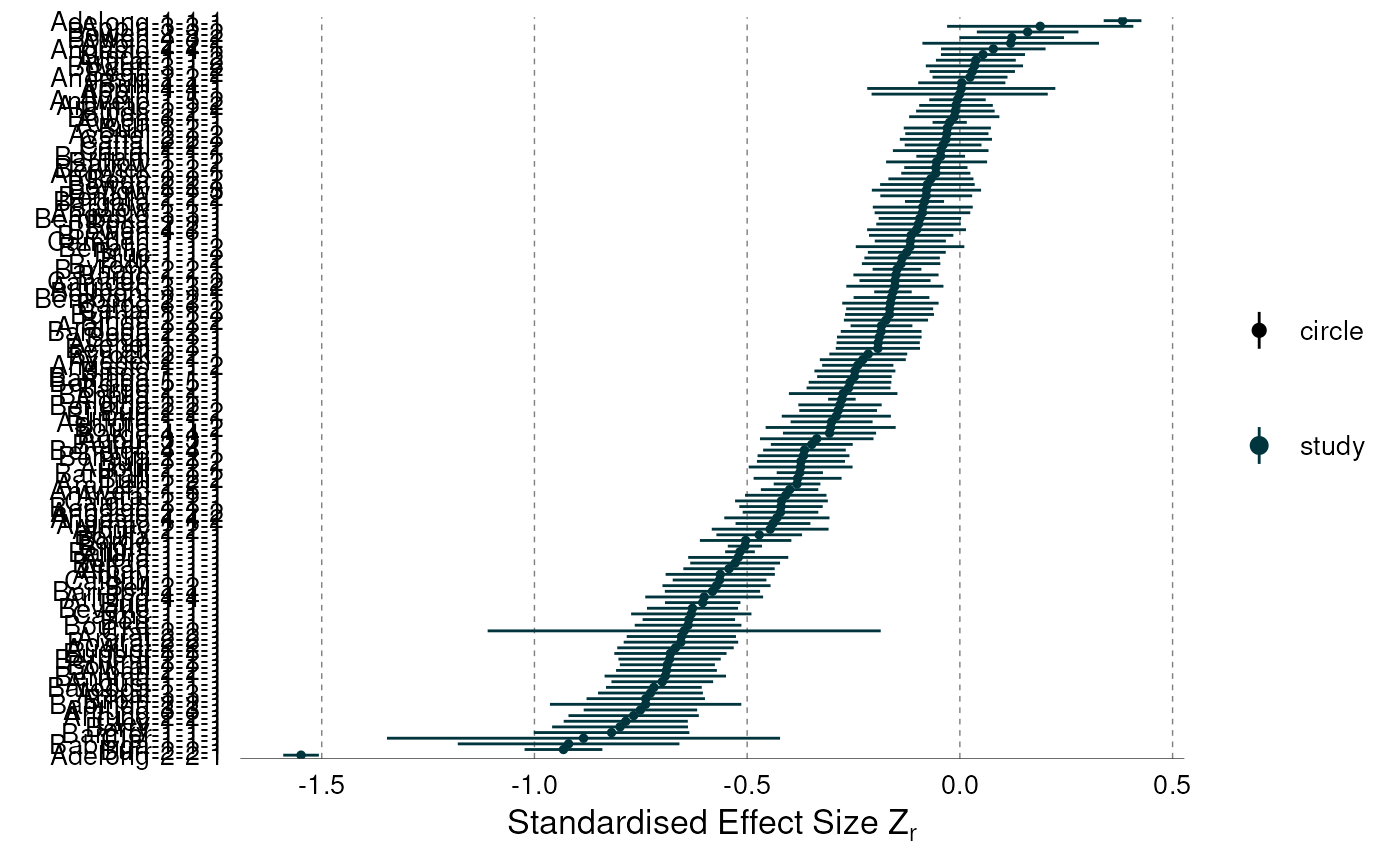
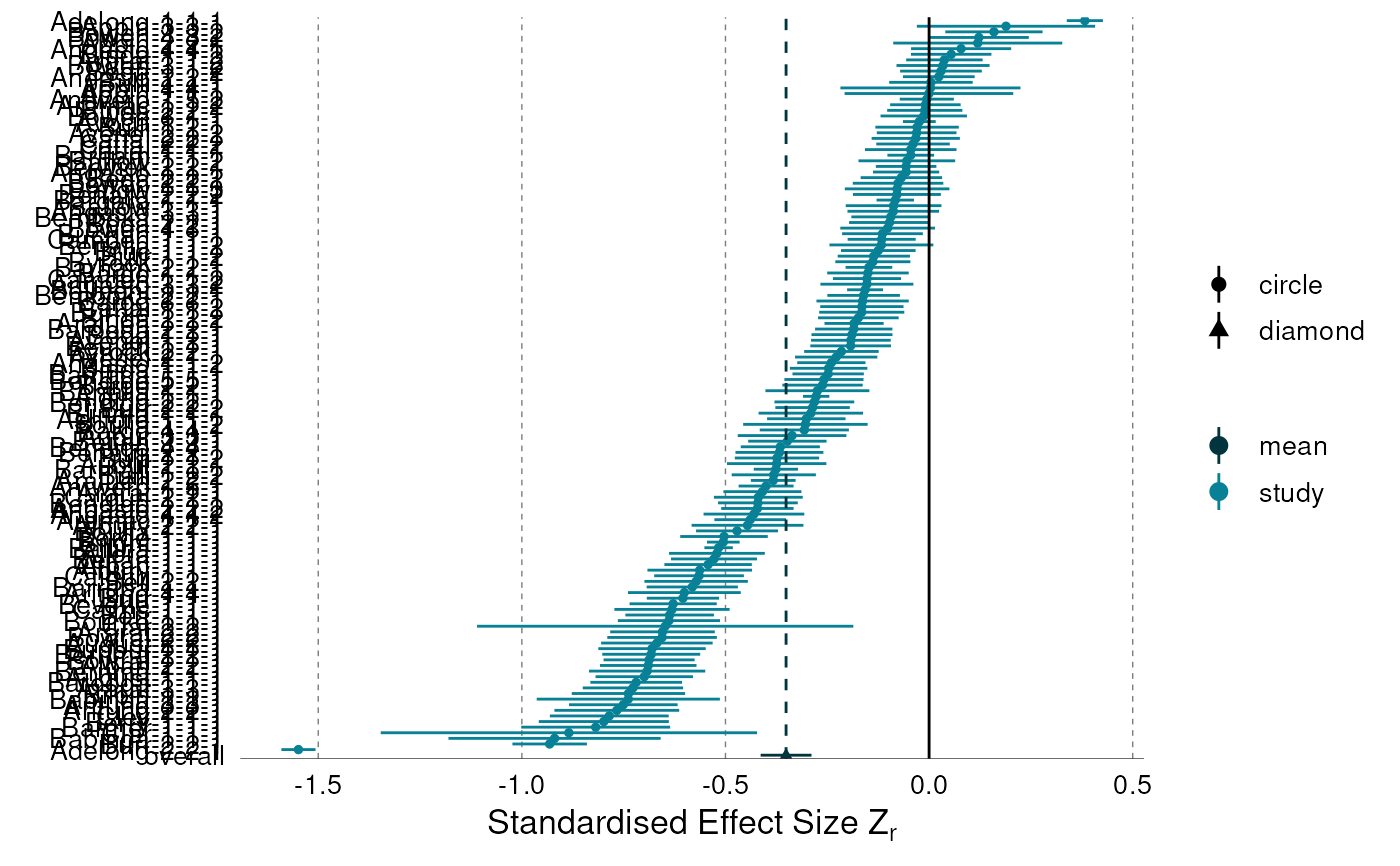
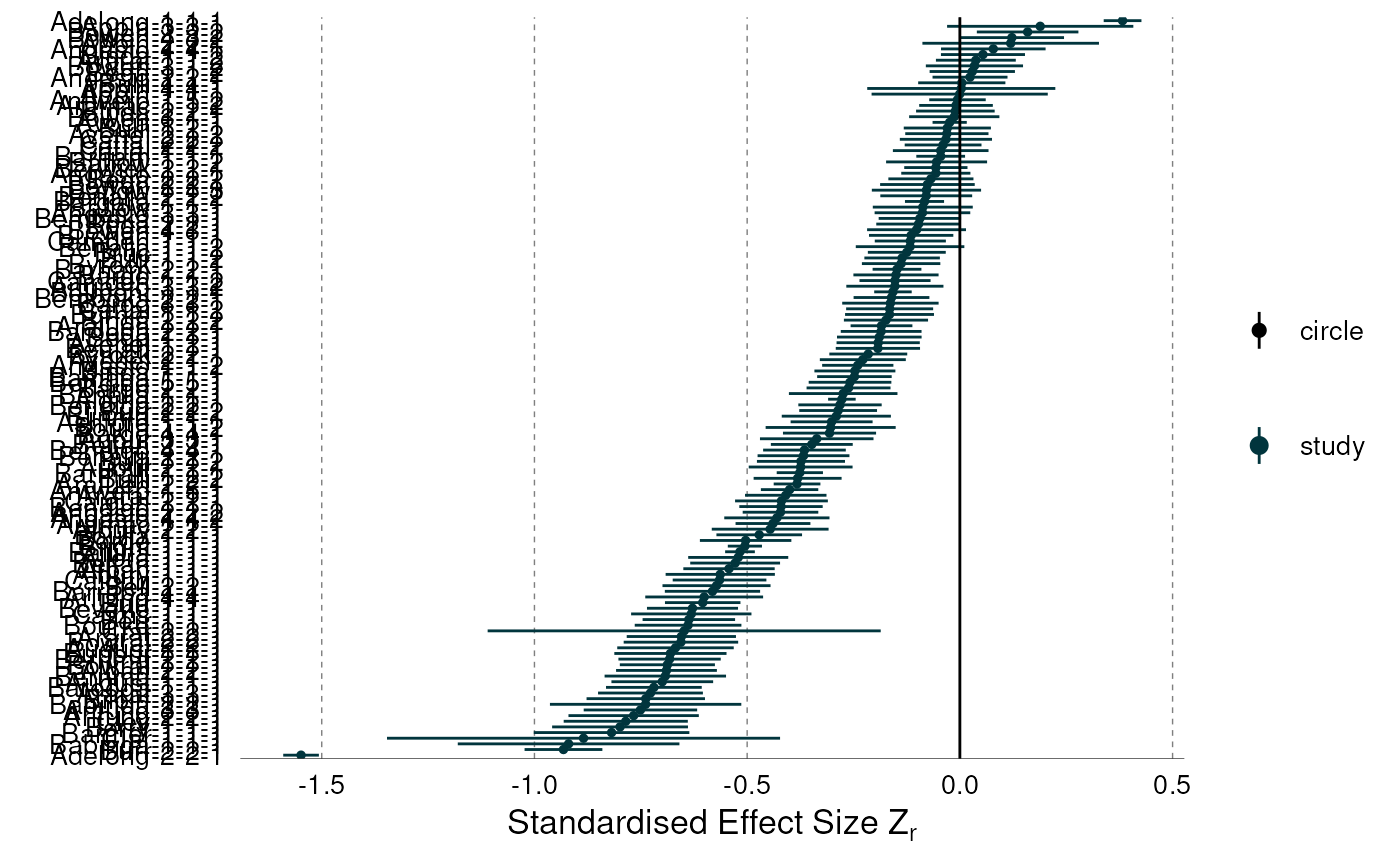
Plot a forest plot using the data from get_forest_plot_data
Arguments
- data
A tibble containing the data required to plot a forest plot
- intercept
Logical. Should a horizontal line be added at 0?
- MA_mean
Logical. Should a dashed line be added at the meta-analytic mean?
See also
Other Plotting functions:
get_forest_plot_data(),
plot_cont_rating_effects(),
plot_effects_diversity(),
plot_model_means_box_cox_cat(),
plot_model_means_orchard()
Examples
data(ManyEcoEvo_results)
model <- ManyEcoEvo_results %>% pluck("MA_mod", 1)
plot_data <- get_forest_plot_data(model)
plot_forest(plot_data)
 plot_forest(plot_data, intercept = FALSE)
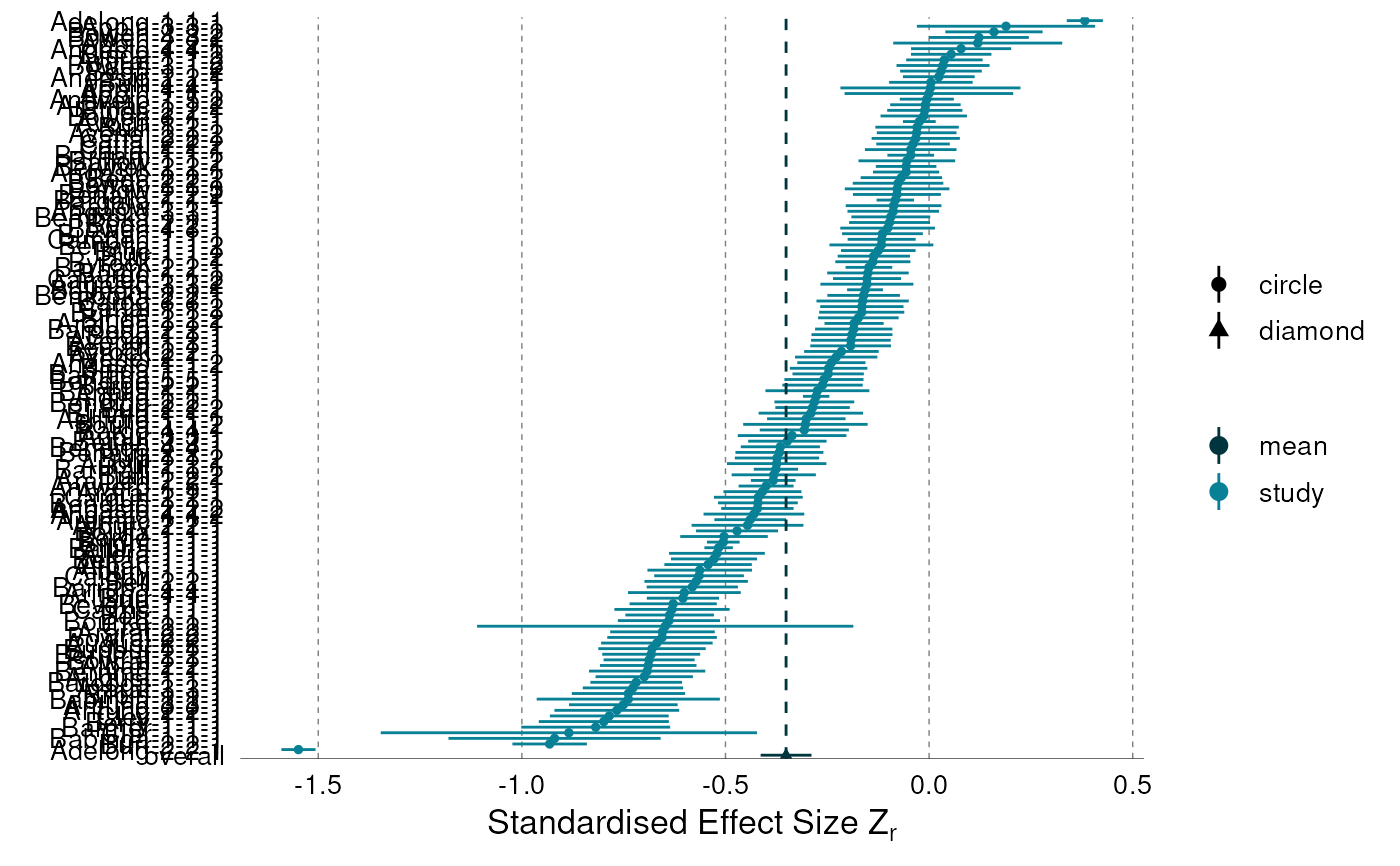 plot_forest(plot_data, MA_mean = FALSE)
 plot_forest(plot_data, intercept = FALSE, MA_mean = FALSE)